
Photo by Mark Shaw https://markshawstudio.com
About Jason Forrest
Jason Forrest is a data visualization and design leader whose work connects business, culture, and public discourse. He focuses on turning complex information into human-centered visual stories that build community, reveal shared histories, and create new opportunities for entrepreneurship.
A former McKinsey Associate Partner and director of its Data Visualization Lab, and the co-founder and former editor-in-chief of Nightingale, the journal of the Data Visualization Society, Forrest now focuses his practice on three platforms: the Jason Forrest Agency, the art duo Data Vandals, and the MPS Data Visualization & Communication program at the School of Visual Arts, where he is the founding chair.
Jason Forrest Agency (JFA): a studio that partners with Fortune 100 companies, NGOs, and cultural institutions to design data experiences and interactive tools that support better decisions and real-world impact.
Data Vandals: A public art collaboration that transforms cities into data canvases, using sculpture, murals, and installations to bring complex topics to broad audiences in places like Los Angeles, London, and New York City.
MPS Data Visualization & Communication program at the School of Visual Arts: An educational platform that trains the next generation of data communicators to combine design, technology, and narrative craft, extending the same values of community-building and experimentation into the classroom.
Together, these platforms let Forrest work as a consultant, artist, and educator, using data to connect communities and build new models for visual communication.
Social:
Something new
👉
Something new 👉

Here’s my story
I’ve been fortunate enough to do a lot of fun and interesting stuff in my life - here’s a chart of my professional career:
I find it increasingly important to reflect on my professional journey to consider where I want to go in the future. I created this personal journey map to understand the relationship between the careers I’ve had. In doing so I was able to learn a lot about myself. I’ve written that my career in dataviz has been a culmination of my experiences in music and technology, but now I see a thread running through all of them.
3 concepts drive my work: Community, History, and Entrepreneurship.
Thinking through the chart above, I see a pattern. First, I tend to connect with people through a shared interest in history & culture, then build a community around those people in order to create entrepreneurial opportunities.

Community
One has to participate in a community to be part of a community. I naturally want to be part of the discourse, and through a sense of community, I have found friendship, intellectual stimulation, and a sense of belonging - three key attributes for a general sense of well-being.
History
I’ve always been fascinated by culture: how it evolves, shapes our history, and connects us through lessons that guide our future.
Entrepreneurship
I’ve always had a lot of energy and an ability to help people organize. Recognizing opportunities and having the drive to make sustained progress toward goals has been another theme and I’ve learned a lot along the way.
Additionally, there are 2 core skills to fit into the mix: design and technology - both cut across the concepts above.
My interest in historic data visualization is just an angle to explore human creativity in design, which I use to engage with the wider community.
A general summary of my career:
School of Visual Arts: MPS Data Visualization and Communication
The SVA MPS Data Visualization & Communication (DV&C) program trains hybrid communicators who combine design, code, visual aesthetics, and ethics to make information trustworthy and actionable. Professionals can immediately apply workflows for collaboration and credibility; students graduate with a thesis and portfolio that translate complexity into visually stunning outcomes.
Our 10-month program, starting in September 2026, combines design, coding, and professional practice, enabling students to transform complex data into clear, persuasive stories that drive action. Professionals level up with systems, collaboration, and leadership skills; students build a portfolio that showcases valuable skills for real-world impact.

Jason Forrest Agency
Organized around a collective of the world’s best talent in data visualization, interactive software development, and design, the Jason Forrest Agency is focused on solving complex problems in business and industry.
We design and build tools to help you explore data for better, faster decisions - or we can help you tell a story to foster understanding and memorability.
Data Vandals
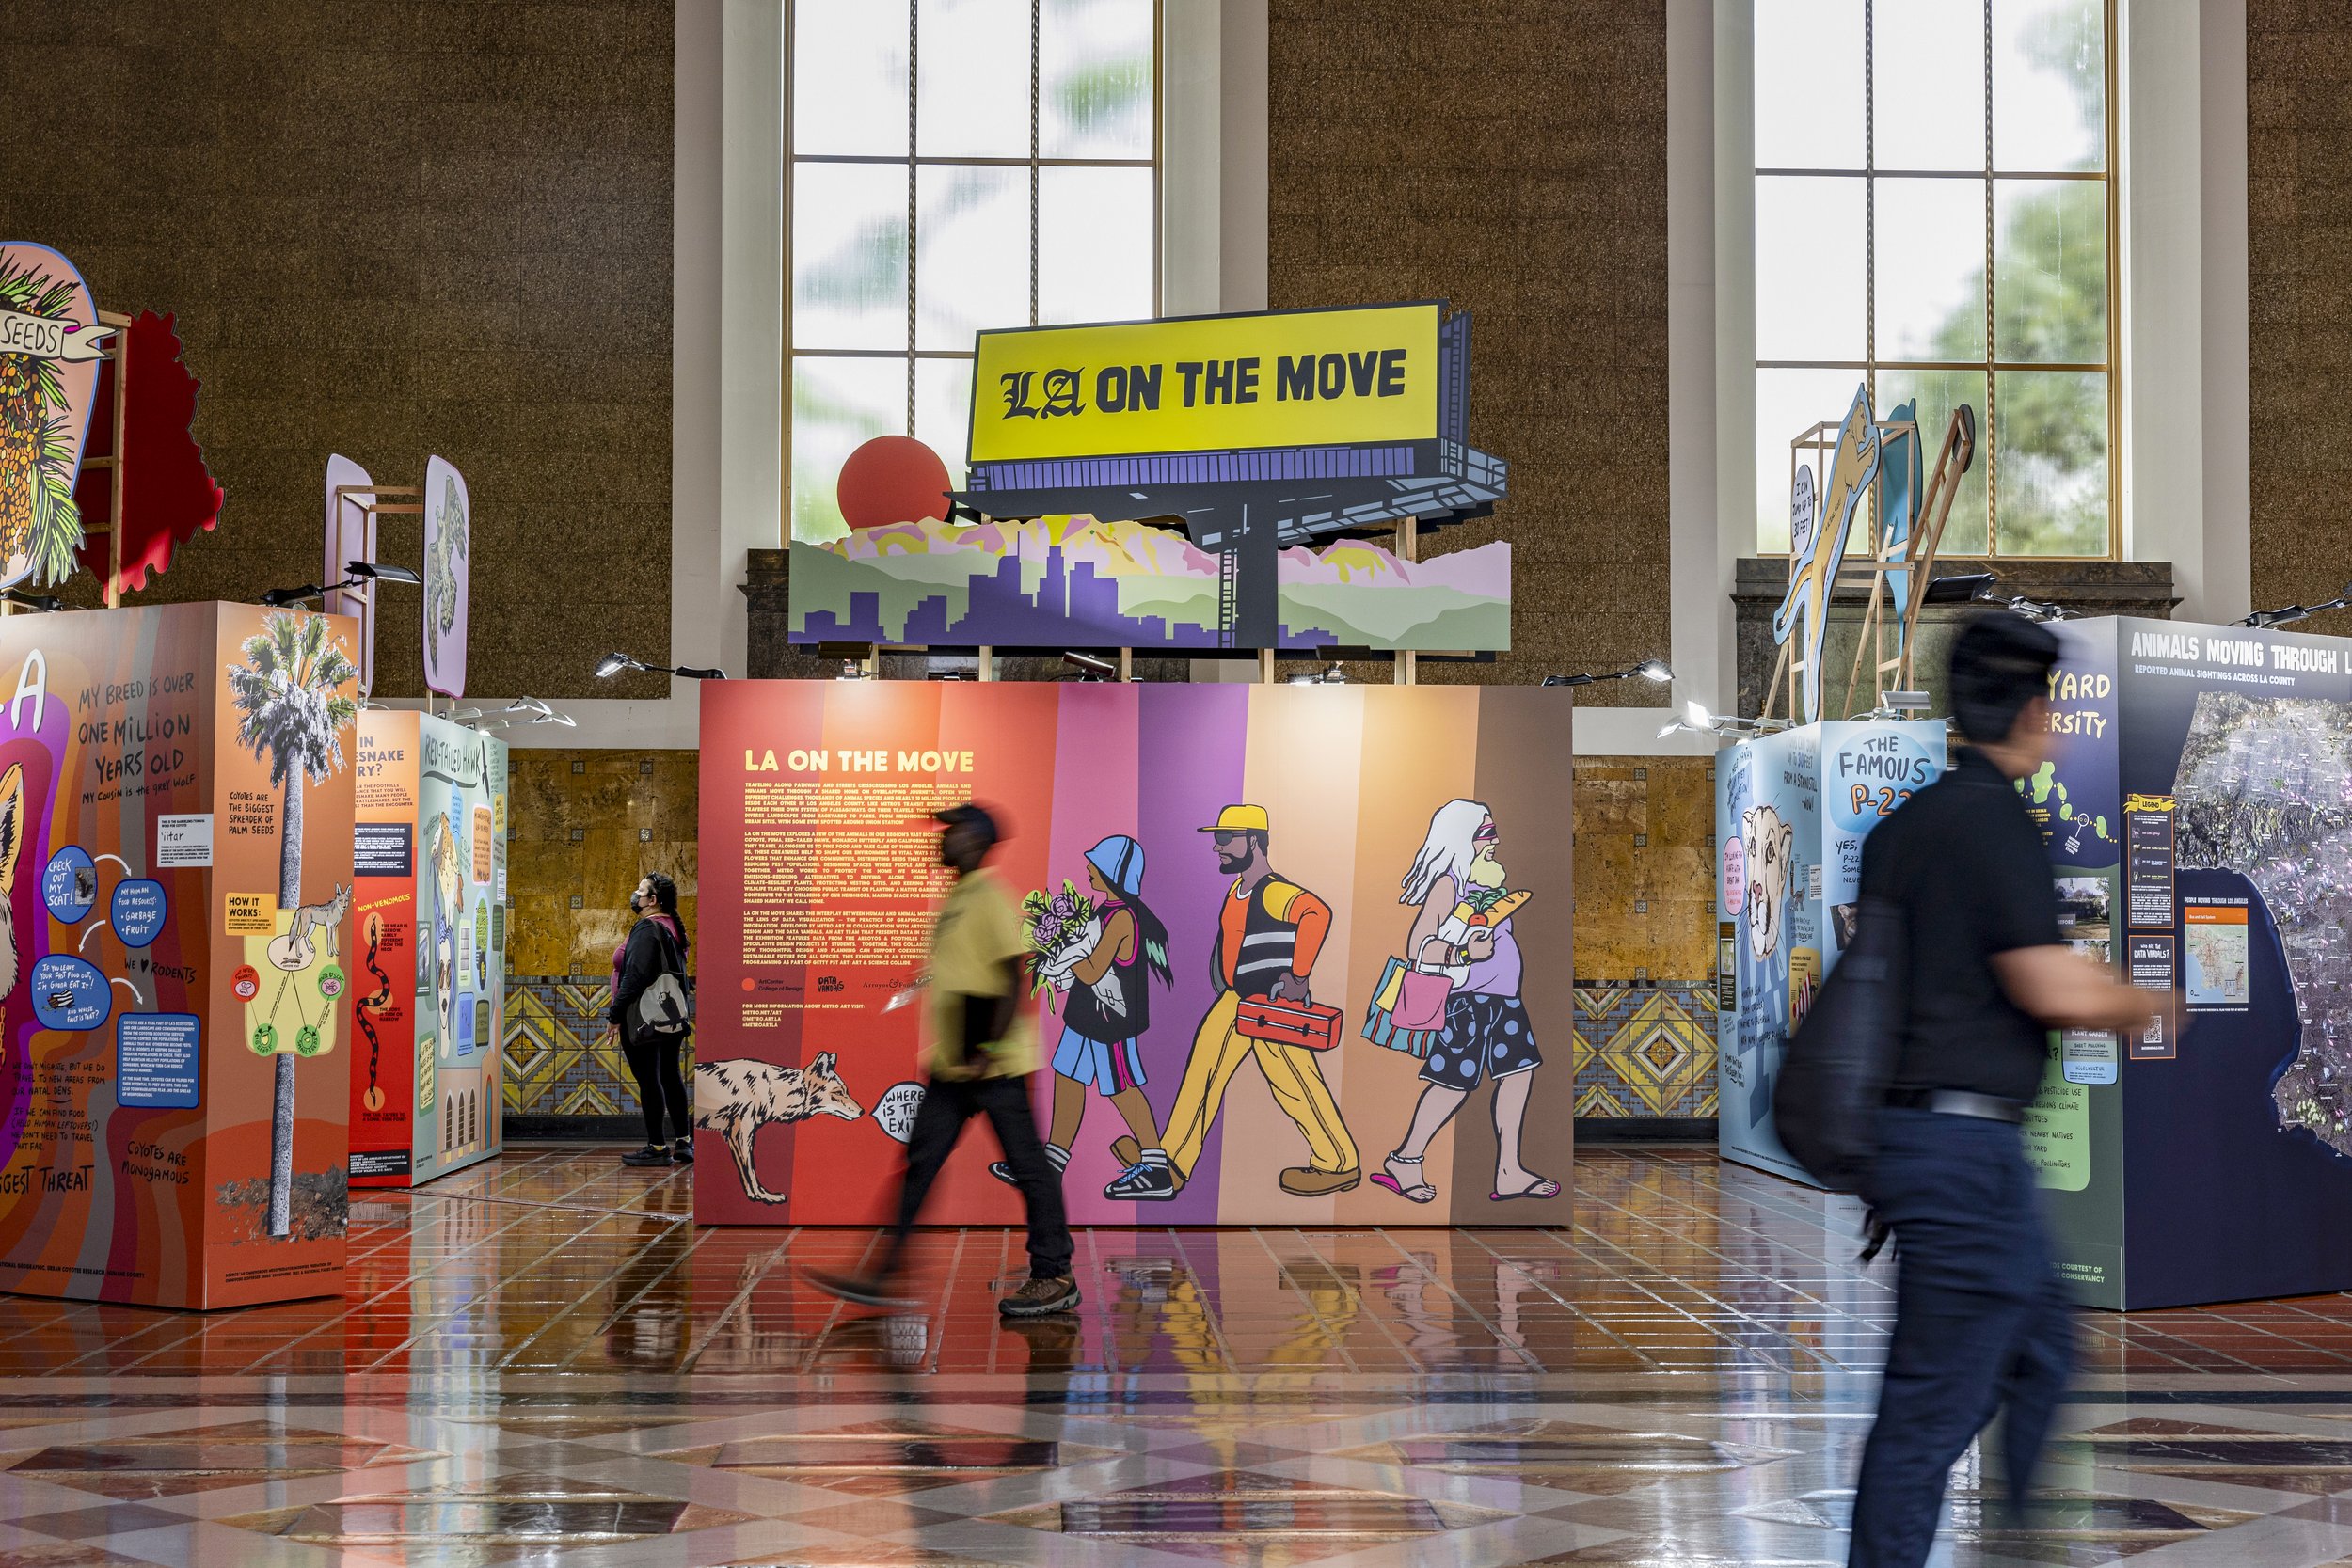
The Data Vandals build art and stories from the numbers that structure our lives. They shake the spray can of empirical facts to cover the walls with bold words and images that confront the shared myths of our society, inviting the viewer to find themselves in the patterns and stake their own claim to change.
Current project: LA on the Move (pictured)

McKinsey & Company
I was an Associate Partner and the Director of the Data Visualization Lab a client-facing team creating interactive data storytelling. Our team worked across industries to bring interactive storytelling to our clients to humanize data and drive real-world impact.
The astute observer will notice the changing nature of my work for McKinsey & Company over the 9 years in the chart above. I began my career as a UX designer, then pivoted into data visualization through a stint working in people analytics.
I was at the center of many of McKinsey’s most exciting large-scale projects like launching the McKinsey Health Institute, designing a major sustainability campaign for COP26, and the Future of NY Summit.
When the pandemic hit I had the opportunity to establish the COVID Response Center, a unique platform to share McKinsey’s cross-functional expertise on issues relating to healthcare and economic data related to the pandemic. This included several novel and widely regarded projects like the Emotion Archive, an exploration of US Unemployment, and our most viewed page, the Vaccination Distribution Map.
Nightingale Magazine
The Data Visualization Society launched in 2019 and I founded its journal - Nightingale - first as a digital platform on Medium, then as a standalone website, and now as a print magazine. We've had over 6M views since we launched, and our print magazine has over 2,000 subscribers across 59 countries.
We consider Nightingale to be a community celebration! Nightingale has become central to the discourse on data visualization globally, with a focus on exploring ethics, best practices, history, career development, and many more compelling conversations.
In 2023, we began our print magazine to continue to inspire and broaden the field of data visualization. We are thrilled to collaborate with so many leaders and practitioners from across our profession to create progressive momentum for our field.
The Data Visualization Society is a professional group with over 22,000 members globally. I also serve on the board of directors and support many efforts across the organization.


Top: Isotype Institute, Rudolf Modley Bottom: W.E.B. Du Bois, Patrick Abercrombie
Writing about art, culture, and information.
My research on the data visualizations of W.E.B. Du Bois began as an obsession with understanding how history can inspire the present. The vast history of information design is a window to the real-world problems people faced in the past and mirrors the issues we have today.
I get really excited by system design and approaches to illustrating information. I have a broad set of interests that help me to find parallels from the fine arts to business to science.
This is why I have been so interested in Isotype and pictorial statistics. I have a series of articles written under the general heading of Isotype: an exploration in design. I am currently working on my first book on the design and methodology of Isotype/pictorial statistics and expect it to be ready for publication later this year.
Lectures and webinars
Currently speaking on:
Data Communication - not Data Visualization
Data Vandals: “How do you talk to a city”
How to get people to actually care about your work
Isotype: history and
I have presented research at many conferences, symposiums, and learning institutions such as Oxford University, Columbia, NYU, Cooper Union, ArtCenter College of Design, Northeastern University, as well as dataviz groups around the world.
Interested in having me present? Drop me a line at the email above!

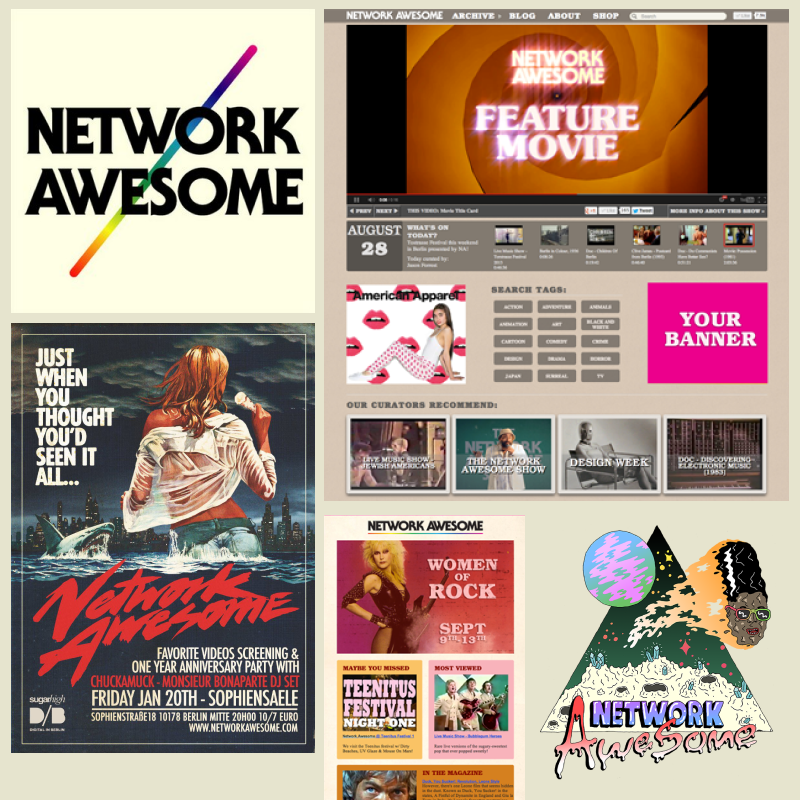
Network Awesome
I co-founded Network Awesome on Jan. 1st, 2011. This online TV startup was curated from over 80,000 videos on youtube.
In less than 3 years the site had over 5M views curated by 270 volunteers from around the world. Our channel included a magazine with 800 feature-length articles to elaborate on and explain our curated media. Network Awesome had a die-hard community with 1.5 Million viewers returning over 50 times.
Network Awesome also had a sister company called Radosaur Productions that focused on live-edited HD video streams. Our team brought the massive music channel Boiler Room from webcams to multicamera HD streaming and produced some of their most watched content to date. Other clients included Pitchfork, Universal Music Group, Tumbler, Bonaparte, and House of Vans.
Radosaur Productions also created 2 seasons of the Network Awesome Show - a concert series featuring some of the best (and weirdest) acts from Berlin as hosted by David Strauss.
Star6
My introduction to software design and development was an iOS app called Star6. We started development a month after the iTunes app store launched in the summer of 2008, and made it to the front page of iTunes in 17 countries eventually selling about 70,000 units.
Star6 was a musical instrument where the user could upload samples to their phone, manipulate the sound using the accelerometer, and record their performance. Considering the iPhone 3 had a 333Mhz processor at the time, Star6 was an innovation powerhouse that would pave the way for many mobile-first instruments to follow.

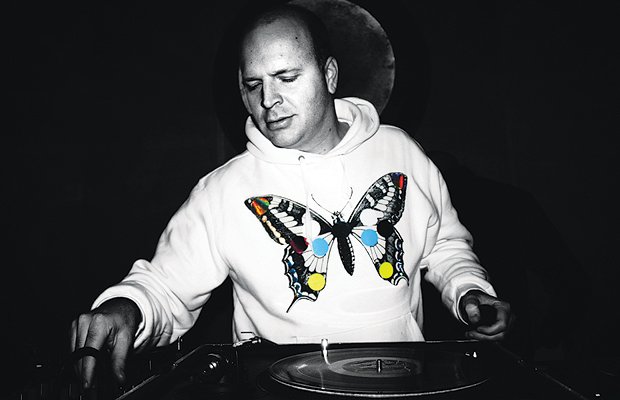
DJing in Berlin, 2003

Electronic Musician
Much of my wild professional life was lived as an electronic musician (wikipedia). I have many releases on record labels around the world (US, Japan, UK, USA, Germany, Austria, Belgium, and Australia, see Discogs 1, Discogs 2).
In 2004, Pitchfork named one of my albums Best New Music which paved the way for a series of adventures crisscrossing the globe.
I performed at some of the world’s biggest music festivals including Glastonbury (UK), Tim Festival (Brazil), Lowlands Festival (Netherlands), Primavera Sound (Spain), Mutek (Canada), Pukkelpop (Belgium), Glade (UK), Arrezzowave (Italy), and Club Transmediale (Germany).
I started in music by launching the Cock Rock Disco label in 2001 which released scores of albums, vinyl, and CDs by many of the most influential artists in breakcore. At the time, I was hosting the influential “Advanced D&D” radio program on WFMU in NYC, which was from 2002-2008. He co-founded the Wasted Festival with Pure and in conjunction with Club Transmediale (CTM) in 2005. The festival was focused on the Breakcore genre and all forms of music that share the same energy and reckless enthusiasm.
My album, “Fear City”, was released in September 2018. You can find more of my music on bandcamp, youtube, and Spotify.
All music guide on Jason Forrest’s “Unrelenting Songs…”
“A Day-Glo burst of wacked-out samples, clattering percussion, sun-kissed melodies, and general electronic insanity. Unless you are the sourest of electronica purists, you can't help but be knocked out by the sheer amount of wit, skill, and joy on display here.”
Pitchfork on “The Everything”
“Jason Forrest's mid-decade breakthrough was a coup when it came to the sampling arts.… these albums were singularly deranged acts of joyful violence against musical familiarity. You like having your music-nerd buttons pushed by recognizable snippets of canonical rock and pop favorites? Well, here they are crumbling to scraps, rattling around like superballs in a laundromat tumble dryer or burning like overheated film stock. Whether they were specific moments of instantly identifiable songs or a more generalist interpretation of certain genres, the way these loops were fed through Forrest's unpredictable yet danceable breakcore rhythms was invigoratingly grotesque.”
Music videos
The video for "Steppin Off” was directed by Jon Watts who went on to direct Spider-man: Homecoming + sequels as well as the series Star Wars: Skeleton Crew. This was Watt’s first music video and it was named the video of the year by Res magazine in 2005.
The War Photographer video by Joel Trussell (creator of the series Pickle and Peanut) was named top 5 by Pitchfork media and was downloaded from my server more than 1.5 million times (this was in the days before Youtube!)
More press photos!
Photos by by Mark Shaw: https://markshawstudio.com
Jason Forrest Portrait by Mark Shaw “Formal”

Jason Forrest Portrait by Mark Shaw “Design”